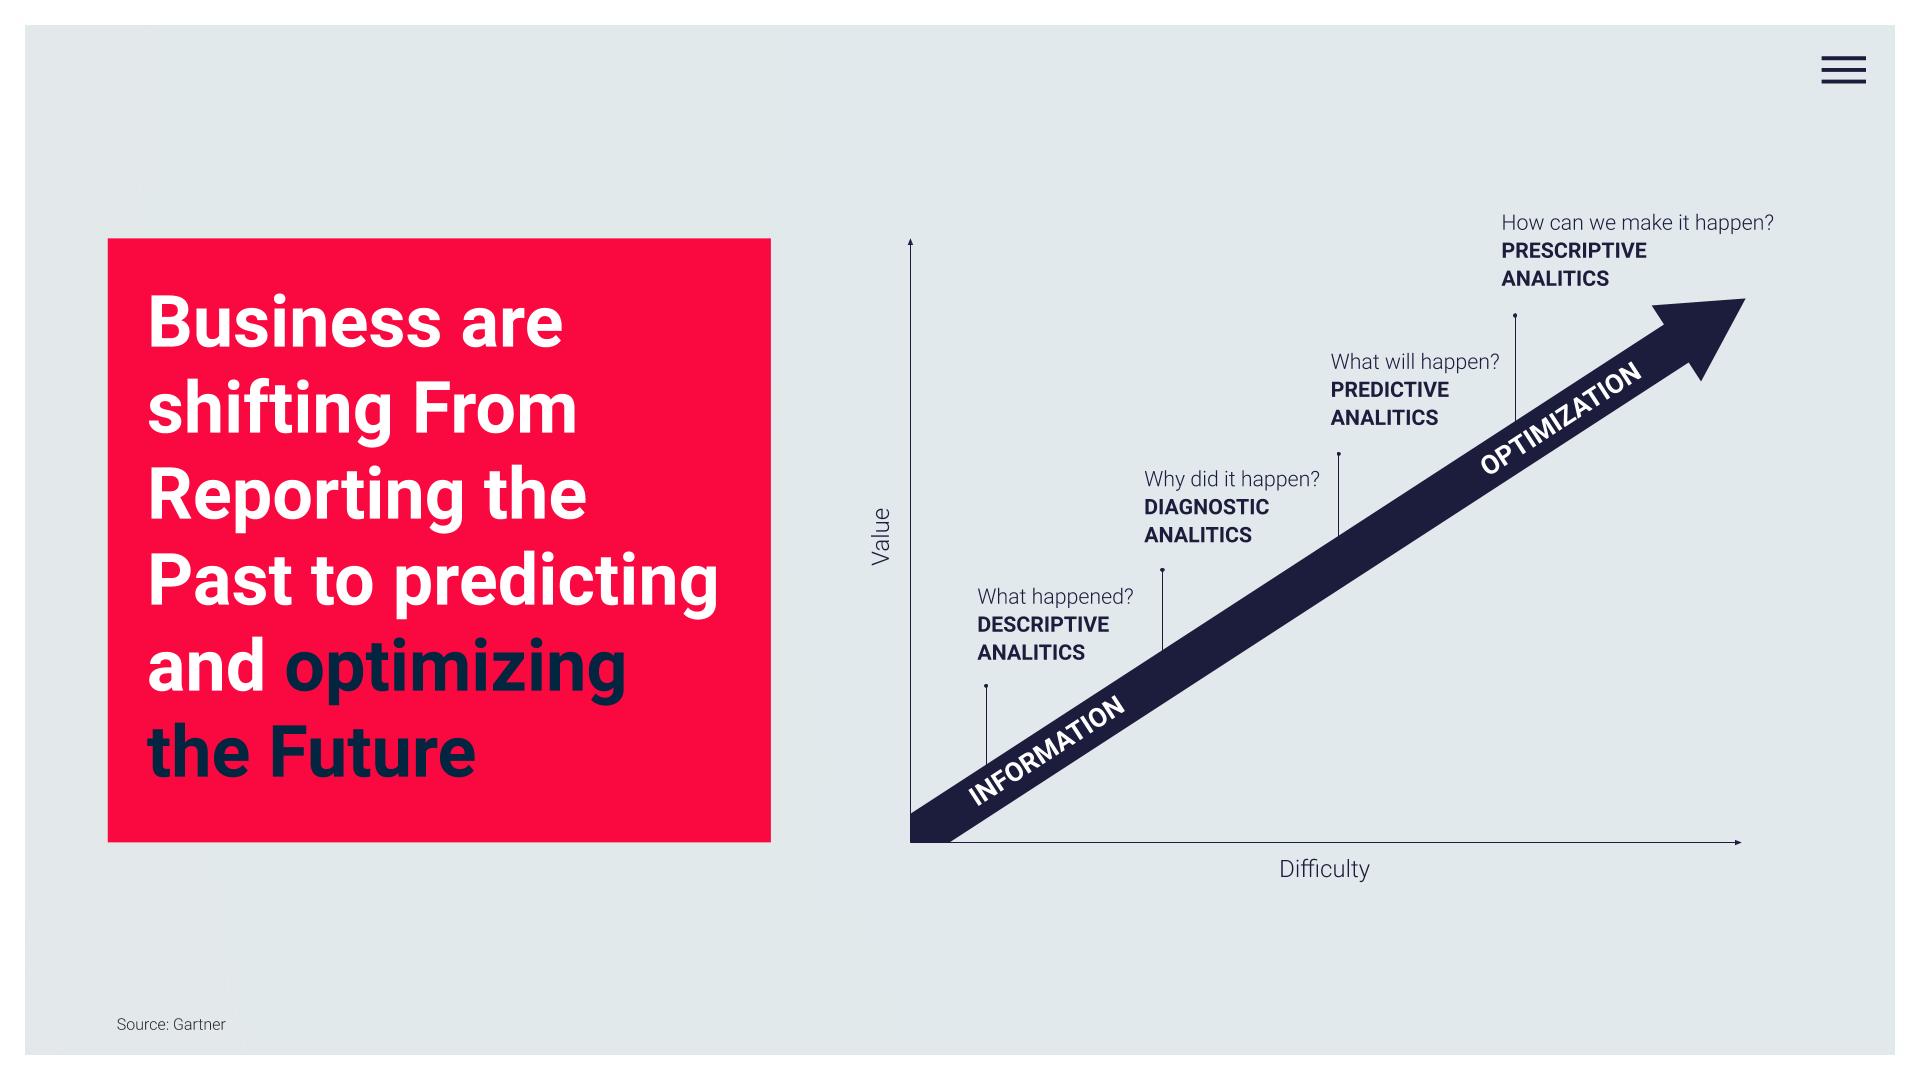
Anticipate the “future” based on data
Predictive models, built by the experts of Data Science Logic, allow prediction of future consumer reactions and events, based on historical data. Advanced analytical algorithms discover patterns contained in a huge number of examples, counted in hundreds of thousands or even millions.
The prediction model built in this way can be used for consumer life style forecasting.
In which areas can predictive modelling be used?
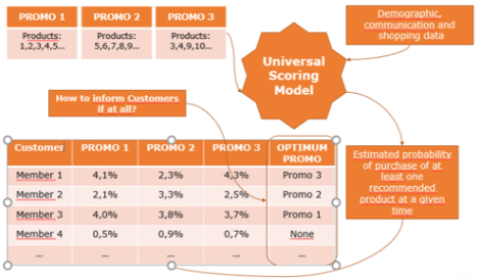
Our models predict what kind of offer is most suitable for a particular consumer. This allows you to communicate with those who are really interested in your offer and invest your communication budget in areas where they will bring the greatest return. This way you avoid “spamming” consumers for whom the offer is not attractive.
Our predictive models predict the probability of purchase by a specific consumer, influenced by marketing communication. The variables such as communication channel (sms, email, digital advertising), its content and time of sending are taken into account. This allows us to tell you when it should be sent, to whom, how and what should be sent. This translates into measurable savings: there is no need to spend money on text messages that will not translate into sales and it is not worth offering a discount to a consumer who is already convinced to buy anyway.
The predictive models also predict at what stage of the shopping path the consumer is and what is the probability of moving to the next stage, under the influence of a specific stimulus. By combining consumer data from multiple sources, it is possible to precisely control the messages sent to the customer.
The predictive models are the “core” of many solutions built by Data Science Logic. They are used in the processes of distribution network optimisation, sales forecasting, in anti-churn models and in optimising marketing campaigns.
Benefits:
- Anticipating consumer behaviour in advance
- Forecasting future phenomena
- Better decisions based on reliable forecasts
- Understanding the factors influencing business-relevant phenomena (e.g. customers churn)
- Introducing changes in the organisation and business processes based on the conclusions of the model
- Possibility to simulate different future scenarios
Clients: Leading marketer from retail industry
Show the customers what will encourage them the most to buy
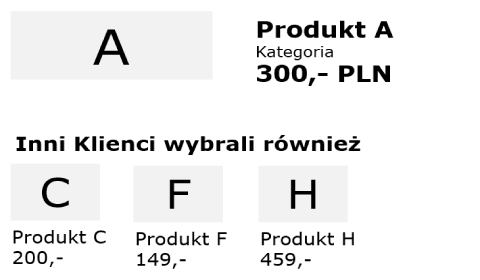
Our recommendation systems select the content to be displayed on the website.
Recommending the right products at the right time significantly increases conversion and cart value.
Our systems include, in particular, cross-sell and up-sell, which translates into higher sales. By using historical sales data, relationships between categories, products, and website traffic history, the experts of Data Science Logic build models to suggest which products to display in the recommendation boxes. Our software integrates the recommendation system with the existing customer's website and automatically controls the recommendations and records their impact on user behaviour. The data collected in this way return to models that are becoming more and more accurate and help to generate ever higher turnover.
What can be the applications of recommendation systems?
A natural area of use of recommendation systems are the websites and especially e-commerce. However, they are also successfully used to personalise the content of emails. The conclusions of the recommendations returned by the system can also be transferred to the surface layout and arrangement of products on the shelves and in brick-and-mortar stores.
Recommendation systems are also used in mobile applications, helping to display content that will increase user engagement, increase the likelihood of conversion to a buyer, or perform other desired action (e.g. a visit to an online or brick-and-mortar stores).
Benefits:
- Higher sales in online store
- Greater involvement of website users
- Higher usability of the mobile application
- Increasing expenditure and consumer and user satisfaction
- Better understanding of the relationship between product categories
Clients: Leading marketer from retail industry
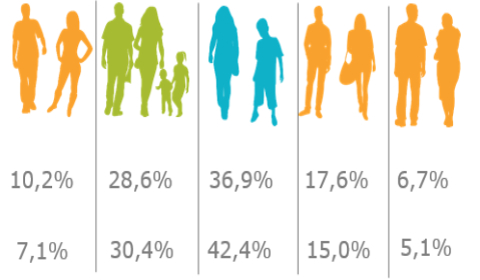
Diversify the offer depending on the Customer group
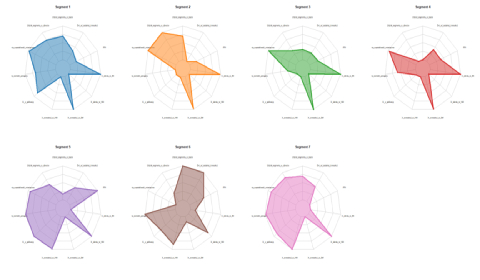
The customers belong to very diverse groups with different needs and habits. Some of the criteria for the division are simple and have long been used in marketing. For example, customers are divided by gender and age. However, such simple divisions are often insufficient in terms of business objectives. The more you know about the consumers, the more information you collect about them, the more sophisticated and precise the criteria for segmentation can be applied by your company.
As the number of variables to be taken into account increases, the labour intensity and complexity of the segmentation process also rises. However, these problems can be solved using machine learning methods. Clarifying algorithms can analyse customers for tens or even hundreds of features and distinguish natural segments (clusters).
Such segmentation may be behavioural, i.e. it may primarily take into account customer behaviour (both purchasing and other behaviour recorded by the company). This allows to achieve clearer and more business-oriented segments compared to the simple demographics-based segmentation still used in many organisations. Understanding the characteristics of customers belonging to particular behavioural segments helps both in making strategic decisions and in differentiating the offer and marketing communication, which can thus be more relevant and effective.
A huge advantage of solutions based on data analysis and machine learning is their scalability and applicability even for very large customer databases (going into millions). This makes it possible to assign each customer known to the company to the appropriate behavioural segment. On this basis, actions can be taken that are suitable to the segment profile.
Benefits:
- Possibility to focus strategically on the most attractive, profitable, developmental customer segments
- More effective communication by adapting the language and content to the customer segment
- Possibility to identify the segment to which a specific customer belongs
- Better understanding of similarities and differences between different customer segments
Clients: Leading marketer from retail industry, Marketer from retail industry, Marketer from retail industry
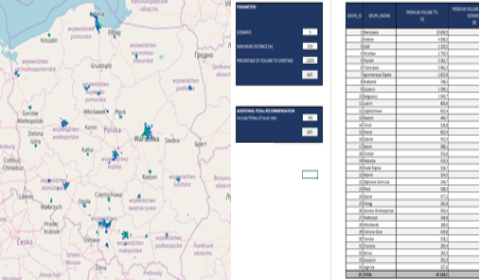
Find out where to open a profitable new outlet
Proper planning of the network of points of distribution and customer service points is not an easy task. The decision to open a new outlet is a big risk. The more effort required to launch a new outlet, the greater the risk. The wrong location means not only sunken start-up costs, but also the need to maintain an unprofitable outlet later on.
Making the right decision requires taking into account a number of factors ranging from the demographic and income potential of the area to the activity of competitors and forecasts of the economic and labour market situation. The more areas to consider, the more complex the decision-making process.
At the same time, omitting important variables may result in a sub-optimal decision.
Advanced data analysis comes to help. Predictive models take into account hundreds of variables and identify key factors for the success of a location. This makes it possible to predict the future performance of the new outlet and the entire network. The impact of the newly opened outlet on the functioning of the existing ones must also be taken into account. The result of advanced optimisation algorithms that take
into account also the effect of cannibalisation, there is a recommendation for an optimal shape of the network. Thanks to the optimisation, we know where and in what order to open new outlets, and which outlets to close. It is also possible to predict with great accuracy how long it will take for newly opened outlets to reach profitability and when the investment will pay off. The results are visualised on maps so managers can easily understand the new network structure and make the best decisions.
Benefits:
- Understanding the factors that affect the profitability of individual outlets and the entire network
- Possibility of forecasting “performance” of a new outlet
- Better estimation of the time needed to get break-even point
- The possibility of objectively comparing many alternative locations under consideration
- Greater conviction that the decision on the new location was right
Clients: Leading marketer from retail industry, FMCG company
Identify your customer's life stage and adapt your offer to it
The customer's life cycle varies from industry to industry. The number of stages that can be distinguished, their duration and the periods between them vary. Sometimes the life cycle is more linear, sometimes the individual stages are repeated. However, it is almost always possible to indicate moments in a customer's life that determine the change of their needs and habits. Managers in each industry are usually aware of their customers' life cycle. This knowledge often comes from qualitative research and experience. The problem is to indicate the stage of life of a particular customer to whom you want to address the offer. With the help of advanced data analytics, combining information from multiple sources such as transaction data, loyalty program data, website traffic, qualitative and survey research, we can model the life cycle and forecast the flow of customers between different stages. The customers usually send signals indicating their readiness to move to the next stage. Early recognition of such signals is possible thanks to machine learning and analytics, which allows to reach the customer with a suitable offer before the competition does.
Benefits:
- Understanding of the customer's behaviour, which shows that they are transitioning to the next stage of their life cycle
- The ability to identify the life stage of a particular customer
- Better tailoring of the offer to the situation and needs of a specific customer
Clients: Leading marketer from retail industry
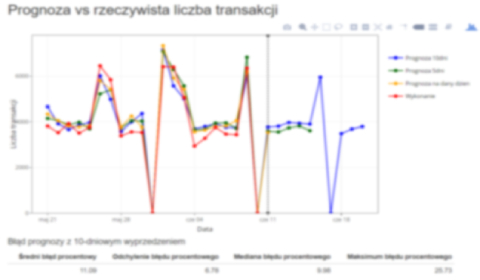
Anticipate how much you will sell in the future
Many different factors influence the level of sales. Ranging from prices, weather, moves of the competition, promotion, advertising budgets to the general economic situation and labour market. The effects of some factors are postponed. In this case, predicting what level of sales can be expected in future periods becomes a big challenge. However, predictive modelling comes in handy.
Advanced statistical models take into account dozens of different factors. They combine data from internal sources with external data, such as the weather, forecasts of the Polish Central Statistical Office (GUS), competition and identify relationships between these factors and the level of sales.
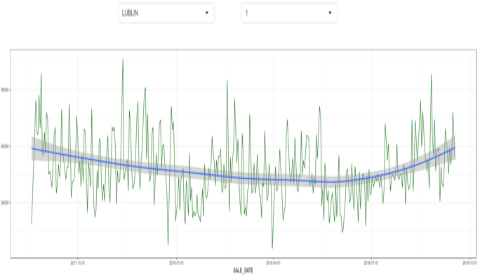
This allows for forecasting sales of the entire network or by individual outlets, product categories and even specific SKUs in different time horizons (e.g. 30 days, 6 weeks, a quarter). The forecast may focus on the sales value, the number of products sold or the number of customers. Predictive models built by the experts of Data Science Logic benefit from the latest advances in machine learning that make it possible to achieve high forecasting accuracy with deviation of up to a few percent.
Each subsequent week the models take into account new sales data and are calibrated to make forecasting more and more effective. The results of forecasts are presented in an intuitive graphical form so that managers can easily make decisions based on them.
The knowledge of future sales trends and the factors influencing them allows us to plan the level of stock , the capacity and staffing of sales outlets/customer service centres well in advance.
Benefits:
- Better planning of production, orders, stock levels, staffing of the outlets
- Better understanding of the direction and strength of sales drivers
- Identification of long-term sales trends and short-term deviations
- Identification of the threat to the execution of sales plans in advance and the possibility of taking timely countermeasures
Clients: Leading marketer from retail industry
The sale of many products and services is characterised by strong seasonality. Seasonality models built by Data Science Logic allow to identify such patterns at the level of product category or even specific SKUs.
This allows you to plan your sales activities in advance, ensure adequate staffing and stocks of materials and goods. A good knowledge of seasonal patterns also helps to plan a calendar of promotional activities. Regular monitoring and analysis of the seasonal aspects of business helps to detect changes in consumer habits (e.g. the increasingly early start of the season due to climate change) and adjust the offer accordingly before the competition does.
Benefits:
- Adjusting the calendar of promotional actions to seasonal patterns
- Proactive influence on seasonality of sales through properly planned marketing activities
- Detecting changes in consumer habits and the associated seasonality
Clients: Leading marketer from retail industry
Get the right information at the right time
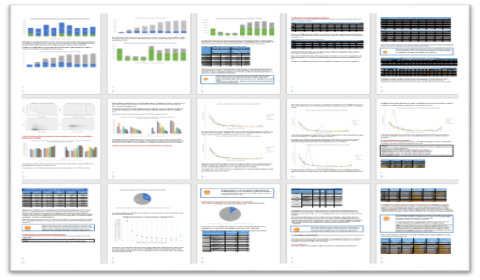
Effective decision making requires easy access to the right information at the right time. Adequate reports often have to be based on data from many different sources. Manual preparation of reports is time-consuming and error-prone. Not only does it entail high labour costs and expenses, but it can also cause delays in accessing information for managers. The automation of the reporting process helps to increase the speed of decision making. The reports are refreshed in intervals according to managers' needs and delivered in the best format for decision making. Clear and interactive dashboards allow for quick assessment of the situation and immediate reaction. The attachments in the form of tables and spreadsheets help to make in-depth analyses and discover the causes of the phenomena. An accessible form of visualisation (also on maps) helps to understand the problem intuitively and to take appropriate actions.
Benefits:
- Always up-to-date information available to managers
- Clear form of presentation
- Faster decision making
- Saving time for preparing reports
- Less chance of errors and delays in reporting
Clients: Leading marketer from retail industry, Marketer from retail industry, Customer from the financial sector, FMCG company
Keep your most valuable customers who are considering leaving you
It is difficult and expensive to acquire new customers. In the majority of mature industries, when the market is not growing as dynamically, you have to drag customers away from your competitors, which often involves offering large discounts and other types of costly benefits, and spending on advertising. In this situation, it is therefore crucial to keep your own customers and prevent them from going to the competition. By using predictive models, it is possible to predict which customers are most at risk of churn at a given time (e.g. during the next quarter). With this knowledge, appropriate retention campaigns can be directed to endangered customers.
Later, with the analytics, it is possible to measure the effectiveness of such campaigns and estimate their ROI. In combination with models that estimate customer value, it is possible to prioritise the retention of the most valuable customers, whose loss would be the most significant burden on the company's budget. It is also possible to allocate the budget for retention measures accordingly. For example, the most valuable customers can be targeted with a telephone campaign supported by an attractive discount offer, while less valuable customers can receive the emails. The key to the success of such a strategy is to forecast the risk of churn as precisely as possible. This is possible thanks to predictive models, as customers usually send signals (sometimes quite subtle) that indicate an increased probability of churn. The more data sources can be used by the models, the more accurate the forecasts (e.g. data on complaints and contacts with the customer service are of great value), but often even the transaction data themselves are a good basis for building models.
The analysis of customer churn makes it possible not only to identify those most at risk but also to understand the factors that increase the probability of churn (e.g. purchase of a specific product or service, visit to a specific point of sale, too long waiting time for a complaint to be processed). This allows you to identify areas within the company where changes are necessary to increase consumer satisfaction and retention.
The phenomenon of churn usually refers to businesses based on subscriptions or contracts (for example, telephone subscriptions), but it can also be defined and analysed for relationships based on irregular transactions. Advanced analytical methods can, in such cases, answer the question of what is the probability that the consumer without a transaction in the last 9 months will return to the store. The answer depends, of course, on the industry, but also on the history of a particular consumer and the moment in their life cycle (the identification of which is possible thanks to customer life cycle models). It is worthwhile to start with an analysis of basic data sources and gradually expand the tool, increasing the accuracy of forecasts and deepening understanding of the phenomenon.
Maximise the ROI of each PLN spent on marketing
As budgets for marketing campaigns grow, the question of how well these funds are being spent and whether they could be better invested becomes increasingly important. Measuring and evaluating the effects of the campaigns is therefore becoming a necessity. By combining data from multiple sources and using analytical tools, you can track which activities translate most into conversion to purchase and return on investment.
The greatest possibilities of measurement and optimisation are offered by mailing within the framework of direct marketing. Knowing the addressee of the message and being able to observe their later behaviour (it is worth doing so, both for online and offline business), let's you connect the marketing action with the consumer's later reaction.
The scoring models can help you to optimally select the promoted product range, message content and the moment of sending to maximise the probability of conversion and the cart value. In the case of periodical campaigns, it becomes important to manage the frequency of mailings, so as not to tire customers and not to evoke the feeling of “spamming” their mailboxes. Similar tools can be used for sending paper catalogues and marketing mailings. Due to the higher unit cost of traditional mailings, the optimisation of the recipient list using scoring models can bring even higher benefits compared to electronic mailings.
The scoring models based on the analysis of geospatial data can also support the processes of optimising the distribution of leaflets and unaddressed mail.
Digital advertising optimisation is possible with the use of advanced attribution models , which make it possible to estimate the impact of individual media and touch-points on conversion (also in terms of value).
For ATL activities in “traditional” media (TV, radio, press) econometric models can be beneficial. The conclusions based on such models help to decide on the size of budgets and their distribution among different channels. They also enable simulation of various scenarios and predicting sales reactions to changes in the amount and allocation of advertising budgets.
The promotional actions are an important aspect of marketing activities. Such mechanisms always entail a cost for the company, whether in the form of lost margins (discounts and price reductions) or products given “for free”. Measuring the actual return on such investments is usually a big challenge. Various promotional activities overlap. The phenomena of cannibalisation inside and between product groups are observed. What is more, the promotion may shift some of the demand from future periods, thus cannibalising the sales in subsequent weeks. Depending on the industry and product range, the strength of individual effects may vary. Nevertheless, the assessment of the effects and success of a promotion based only on the increase in the sales volume over its duration is insufficient and may lead to wrong conclusions, which in turn lead to sub-optimal decisions and allocation of the marketing budget. A multi-faceted analysis of the real impact of promotions on business is actually possible only on the basis of advanced analytical methods. The core is always to 'clean up' the sales generated during the promotion period from the sales which, without the promotion, would include other products from the same product group or would be generated in future periods. In turn, increased sales of goods from complementary categories should be added (the so-called halo effect). This is the only way to obtain information about actual additional sales as a result of the promotion (incremental sales).
The models built according to appropriately selected methods can estimate the strength and direction of the promotion's impact, taking into account additional factors, such as promotions taking place at the same time for a different product range, seasonality, price flexibility, advertising support or the actions of competitors. The model can be used as a basis for the development of simulations of different variants of the promotional calendar and its optimisation not only for one specific action but for the whole sequence of actions properly planned in time.
Clients: Leading marketer from retail industry
Despite the constant increase in importance of e-commerce and electronic channels of customer contact, many companies still devote a significant part of their budgets to traditional forms of communication such as flyers, catalogues or in-store leaflets.
Their preparation, printing and distribution entails significant costs. It is therefore important to measure the effectiveness of activities based on printed materials and optimise the use of the budget allocated to such activities. In other words, you have to answer the question: what is the ROI of the activities carried out and where to distribute, when, how often and what is worth distributing to make the ROI as high as possible with a limited budget.
By analysing data from existing distributions and combining them with data from cash-register systems, transactions recorded on loyalty cards, website traffic and data characterising the demographics of distribution areas, it is possible to build a model estimating the impact of printed materials on sales and other KPIs relevant to the company's business (e.g. new customers registering in the loyalty program).
With the help of the model created, it is possible to predict the impact of a specific type of material at a specific place and time and to carry out reliable simulations of what would be the effect of abandoning planned activities. In other words, it is possible to simulate what would happen if the costs were reduced and the in-store leaflets were not distributed in a certain area. Would the decrease in revenue and margin prove to be higher than the savings on printing and distribution costs? It is also possible to identify areas where distribution would be more beneficial.
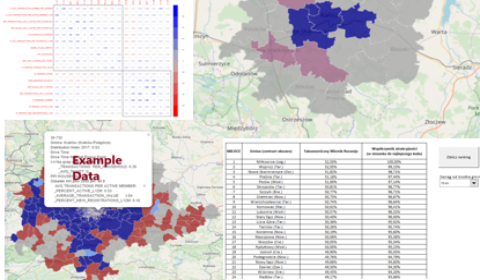
The effect of the optimisation is a list of areas with suggested expenditures, in which it is worthwhile to carry out the distribution. The prepared list is always accompanied by a map, which helps to better understand the recommendation. The optimisation can be carried out at the level of a municipality, postal code or smaller defined areas (e.g. sectors used operationally by companies distributing unaddressed mail).
For additional synergy effects, the analysis of distribution of printed material should be combined with a more comprehensive optimisation of other marketing channels. It allows for the recognition of interactions between different channels and the identification of situations in which different channels strengthen their impact and those situations in which distribution channel cannibalisation is observed. This allows you to answer questions such as: whether the in-store leaflets are more effective in combination with internet advertising, geotargeted for a given area, or whether it is an unnecessary duplication of expenses and it is more effective to separate these activities in space and time.
Clients: Leading marketer from retail industry
Many aspects of business are related to location. It is important where the customers come from, how much time it takes them to get to your outlet, where the competitors are located, where it is worth opening new outlets. The neighbourhood and demographic potential of the areas around the points of sale is important. When analysing the location, we calculate the time of travel taking into account the road conditions depending on the time and day of the week. We use various sources of data on demography and income. We take into account infrastructure development plans, new housing investments, population migrations. A natural form of communication of the results of such analyses are maps. The experts of Data Science Logic use interactive maps in the html format to easily visualise phenomena relevant for managers. This enables a better and more intuitive understanding of their impact on business and making the right strategic and tactical decisions. The map visualisations can also be part of interactive dashboards.
Clients: Leading marketer from retail industry, Marketer from retail industry, FMCG company