Bayesian Causal Analysis – an Effective Method For Measuring the Effectiveness of Marketing Campaigns

We send up to a dozen different marketing messages to our customers in a week. Often the same audience participates in many different campaigns. We use various criteria for qualifying consumers for mailings. Usually different campaigns compete for the same “best” customers. We can’t always use control groups. Sometimes, by mistake, a control group gets syndicated. In the end, we ask ourselves: which of these actions had a real positive effect and translated into important indicators for us. Doesn’t this sound like an everyday occurrence in many companies?

Traditional approaches, like A/B testing or simple statistical models, fail in more complex situations where campaigns overlap, there are effects of confounding variables, and customer behavior varies. Bayesian causal inference offers an innovative and flexible alternative that addresses these challenges. Below, we will look at how the model works, its key advantages, and the limitations to be considered.

Challenges faced by marketers

Simple methods can only be effective under ideal laboratory conditions. The reality of the market, however, is far from them. Marketing faces many challenges that make it difficult to accurately assess the effectiveness of campaigns. We can point out here, among others:

  • Campaign overlap – customers often receive several marketing messages in a short period of time, making it difficult to attribute sales to a specific campaign. – customers often receive several marketing messages in a short period of time, making it difficult to attribute sales to a specific campaign.

  • Criteria for assigning customers to campaigns – the selection of customers for a campaign is not random; higher-value customers may receive promotions more often, which can distort analysis results.

  • Customer diversity – Customer responses to campaigns vary based on preferences, demographics and buying patterns. Overlooking these differences leads to results that do not reflect the true effectiveness of the campaign.

Bayesian causal inference addresses these challenges by taking into account varying customer behavior, overlapping campaigns, and the impact of customer selection on campaign outcomes.

What is Bayesian causal analysis?

Bayesian causal analysis is a statistical method that makes it possible to assess the real impact of marketing campaigns on either sales or other key metrics (e.g., loyalty) for a marketer. This is achieved by building a model that describes the mutual influence of various factors on the generated consumer behavior. The model integrates the marketer’s prior knowledge (e.g., gleaned from analysis of previous campaigns), updates it based on available data, and then generates probability distributions for campaign effects and customer behavior.

Key Components of the Model

In a Bayesian model for causal analysis of marketing campaigns, three elements are key:

Baseline Purchase Propensity – Regardless of the campaign, every customer has a natural propensity to make their next purchase. This depends, for example, on their lifecycle stage, current attitude toward the brand, or financial situation. Properly modeling the baseline spending level, taking into account demographic, behavioral, and transactional characteristics, helps isolate the actual incremental impact of the campaign.

Campaign Impact – Each campaign included in the analysis has its probability distribution of impact on sales modeled separately. This allows an assessment of how much the campaign increases sales above the baseline spending level.

Hierarchical Structure – To ensure scalability and improve the interpretability of results, customers can be grouped into segments, such as by demographics or behavioral traits, with shared parameters for each group.

Advantages of Bayesian Causal Analysis in Marketing

  • Attribution Accuracy – modeling separate parameters for campaign impact and baseline customer behavior allows overlapping campaign effects to be disentangled, resulting in more precise attribution of sales to specific activities.
  • Resilience to Non-Random Campaign Selection – the model accounts for the selection criteria’s impact, giving it an edge over traditional methods. For example, wealthier customers might be more frequently targeted by certain campaigns. Without considering their natural tendency to spend more, the model would overestimate the actual campaign effect.
  • Accounting for Customer Heterogeneity – the Bayesian method captures the diversity in customer behaviors and characteristics. The model reflects how these factors influence both baseline purchase propensity and the effectiveness of the campaign itself (as the same campaign may affect different customer groups in different ways).
  • Precise Estimation of Uncertainty – the Bayesian method provides a full probability distribution of outcomes, offering better insight into the reliability of the estimates. This minimizes the risk of drawing incorrect conclusions from the analysis.

Limitations of the Bayesian Method

Like any methodology, Bayesian causal analysis has its limitations and challenges:

  • Sensitivity to Initial Assumptions – with limited data, the method is quite sensitive to initial assumptions about the campaign’s presumed effectiveness. However, as more data becomes available, the influence of these prior assumptions diminishes.

  • Analytical Expertise – While the results are straightforward to interpret and accessible to those without specialized data science knowledge, conducting the analysis requires advanced statistical, analytical, and programming skills.

  • Technical Requirements – the method is computationally intensive, and analyzing large consumer databases with numerous campaigns demands advanced computational infrastructure. Properly adapting the model to available data and computational capacity can mitigate risks and challenges. This highlights the importance of skilled personnel conducting the analyses for the marketing department.

Conclusion

Bayesian causal analysis provides an accurate and scalable approach to evaluating the impact of marketing campaigns on key marketer metrics (e.g., sales, loyalty). The model accounts for customer heterogeneity, selection criteria impacts, and overlapping campaign effects, offering more precise results than traditional methods. While there are limitations, such as dependence on initial assumptions and computational complexity, the method delivers valuable insights that support data-driven decision-making. This enables marketing teams to better allocate budgets, tailor campaign strategies, and optimize customer communication, ultimately enhancing marketing spend efficiency.

Junior Data Analyst

We are looking for a proactive, committed individual who will be accurate, conscientious and independent in their work. We value in an employee communication skills and a desire for intensive development in areas related to data analysis and machine learning.  In this position, you will be responsible for supporting the team in solving business problems using data analysis methods (data science) in cooperation with the customer service department.

Main tasks:

  • Establish requirements and scope of analytical needs with business users;
  • Preparing reports and performing analysis as agreed;
  • Exploring databases (customer segmentation, scoring models, basket analysis, forecasting, recommendation models);
  • Working with MS SQL databases and unstructured data;
  • Drawing conclusions and presenting results (also in English);
  • Automating reporting and data processing;
  • Participating in working meetings with clients as needed;
  • Continuous development and enhancement of competencies.

Qualifications:

  • Education (may be in the course of study) in line with the job profile (data analysis, statistics, quantitative methods, computer science and econometrics, information technology, mathematics) or qualifications documented by other adequate means;
  • Knowledge of data analysis methods and statistics;
  • Basic knowledge of data mining methods;
  • Good knowledge of SQL;
  • Basic knowledge of R or Python (optional);
  • Very good knowledge of English;
  • Ability to present analysis results in a way that is understandable to a business audience.

We offer:

  • Employment contract / B2B contract;
  • Necessary work tools;
  • Private medical care (Luxmed);
  • Opportunity to contribute to Mybenefit Multisport card;
  • Possibility to work remotely in a hybrid system;
  • Optional: flexible working hours;
  • Opportunity to participate in English language learning classes;
  • Access to online course platform, subsidized training and courses;
  • Development in a rapidly growing company, participation in innovative projects;
  • Real impact on the development of the company.

Please send your CV to contact@datasciencelogic.com in the title of the message, writing the position for which you wish to apply.

Please be advised that the data administrator is Loyalty Point Sp. z o.o., 1 Franciszka Klimczak St., klatka B. Contact with the company: at the company’s headquarters and by e-mail: kontakt@loyaltypoint.pl tel. +48 22 608 52 70, contact with the company’s Data Protection Inspector: iod@loyaltypoint.pl.

Data Analyst

We are looking for a proactive, committed individual who will be thorough, conscientious and independent in their work. In this position, you will be responsible for performing analytical tasks and projects to support the company’s and our clients’ business decisions and processes.

MainTasks:

  • Independently or with support, establish requirements and scope of analytical needs with business users, prepare reports and perform analysis as agreed;
  • Maintaining documentation of ongoing tasks and projects;
  • Exploring databases (customer segmentation, scoring models, basket analysis, forecasting, recommendation models);
  • Working with MS SQL databases and unstructured data;
  • Drawing conclusions and presenting results (also in English);
  • Automation of reporting and data processing;
  • Participating in working meetings and presentations with clients;
  • Sharing knowledge with junior team members;
  • Continuous development and enhancement of competencies.

Qualifications:

  • Min. 1 year of experience in analytical positions;
  • Experience in applying predictive models and segmentation techniques;
  • Knowledge of data analysis methods, statistics and data mining;
  • Very good knowledge of SQL;
  • Knowledge of R or Python;
  • Very good knowledge of English;
  • Ability to present analysis results in a way that is understandable to a business audience.

We offer:

  • Employment contract / B2B contract;
  • Necessary work tools;
  • Private medical care (Luxmed);
  • Opportunity to contribute to Mybenefit Multisport card;
  • Possibility to work remotely in a hybrid system;
  • Optional: flexible working hours;
  • Opportunity to participate in English language learning classes;
  • Access to online course platform, subsidized training and courses;
  • Development in a rapidly growing company, participation in innovative projects for the largest retail and non-retail companies in the country;
  • Real impact on the development of the company.

Gain or loss? Evaluating promotion effectiveness with the help of data science

Up to 80% of promotional campaigns do not bring any noticeable increase in sales or the cost of granted discounts is higher than the margin generated on additional turnover – proves a Boston Consulting Group study. The former can be abandoned without fear of lost sales. It is necessary to resign from the latter ones, because their financial effect is negative. Meanwhile, the strategy of many retailers is based on promotions. This applies to most industries. And what is more, it concerns both stationary channels and online trade.  The pressure of competition, the fight for market share and consumer habits mean that the annual number of offers often runs into hundreds or even thousands. So the space for optimization is huge.  But how to distinguish profitable promotions from those generating losses? How to measure the real effect of a promotion? Is it possible to predict the outcome of a promotion before it even starts? How can we better plan promotions?

Measuring the effect of a promotion

The key to success is to measure the effects. Without knowledge of the actual results of a promotion, managers are doomed to strategies such as copying the “proven” calendar of previous years, reacting to the actions of competitors or simply their own intuition. In theory, the task may seem simple. It is enough to compare sales during the promotional period with… Well, exactly… with what? Various possibilities come to mind: maybe sales before and after the promotion period? Maybe sales in the same period of previous years? How about excluding certain outlets from the promotion and using them as a comparison group?

However, demand for products is often seasonal and changes regardless of promotions. The previous year may have been different due to the macroeconomic situation or the entry of a new competitor into the market. Selecting a representative comparison group can be difficult, if not impossible, for online retail. Additionally, promotions overlap. Some are heavily advertised in the media, others only at the store shelf. The real business world is complex and overly simplistic methods of analysis can lead to incorrect conclusions. 

With help come advanced methods of data science. Thanks to them, it is possible to develop a model that takes into account many factors influencing the effect of a promotion. From the assortment covered, through the amount of discount, additional conditions and mechanics, other concurrent campaigns, to the weather, advertising activity and actions of competitors. It is necessary to collect accurate data on historical promotions and their characteristics. A properly prepared model allows to isolate the influence of individual factors on sales. This enables understanding their impact, both for historical campaigns and predicting the effect of promotions yet to be planned. 

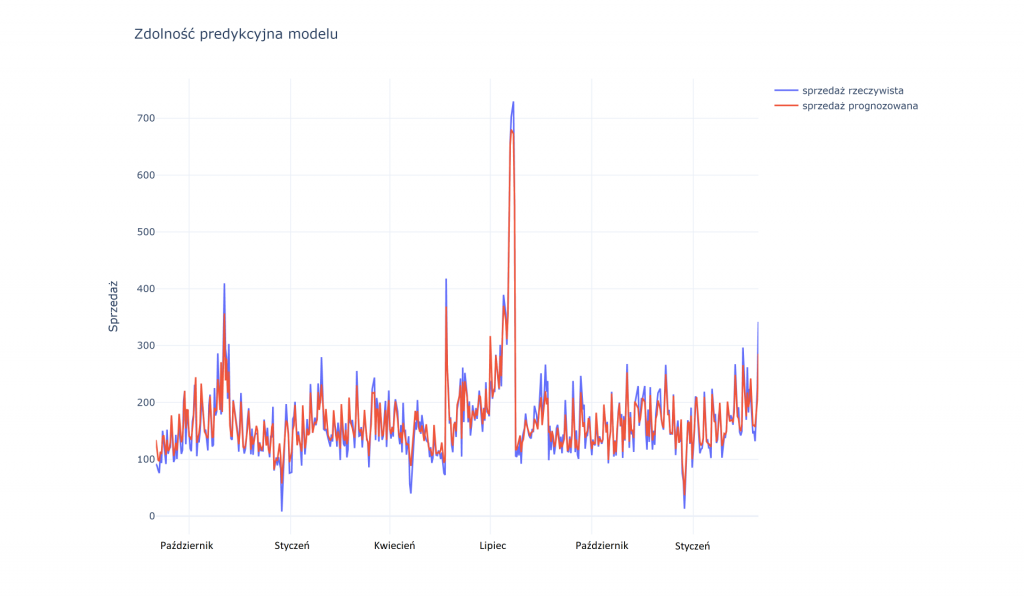
The graph below shows the achievable prediction accuracy of the model. The blue line represents actual sales, while the red line represents sales predicted by the model. As you can see, both lines are very close to each other. In practice, it is impossible to avoid some deviations, especially visible on days with extremely high or low sales, but the model identifies trends and directions of changes very well. 

Ocena zdolności predykcyjnej modelu

Testing a promotion before it begins

A prepared model with adequate predictive capability allows to forecast sales depending on the date, duration, scope and nature of the promotion. This makes it possible to simulate various action scenarios and find answers to questions such as:

– will the promotion generate additional sales?

– what is the best period to conduct a promotion?

– what is the optimum duration of a promotion?

– what kind of communication support is worth providing for the promotion?

– Is it worth running the promotion, taking into consideration all effects?

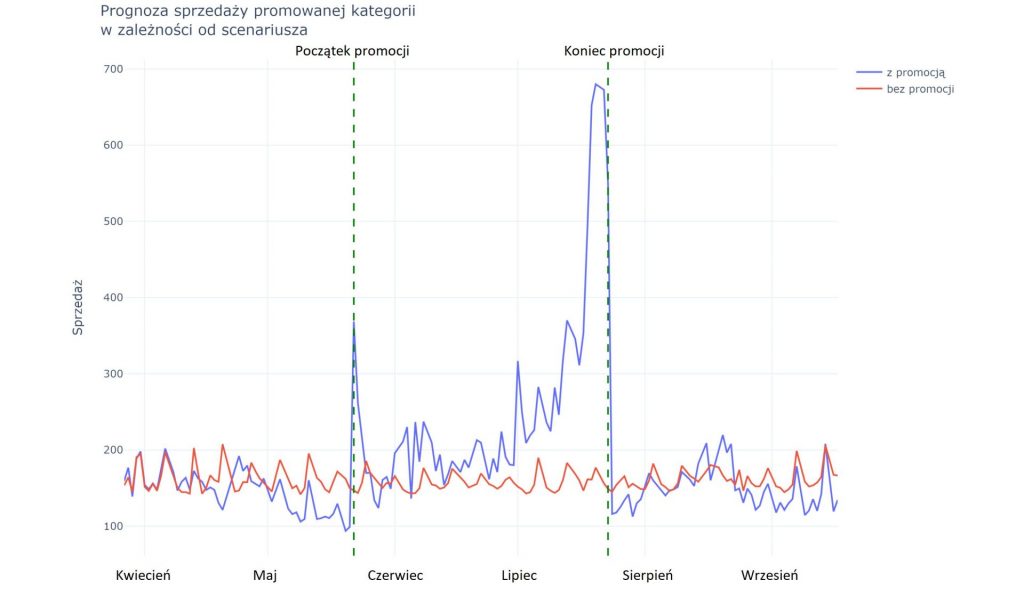
The chart below shows a comparison of sales in the scenario assuming running the promotion (blue line) in comparison with the baseline scenario in which the promotion would be abandoned during the period under consideration (red line). It is clear that the blue line is above the red line for most of the duration of the promotion. Particularly large increases are seen at the end of the promotion period, as well as at the beginning. The timing of the promotion was clearly communicated to consumers in this case hence the accumulation of sales. In the scenario without the promotion, sales would be more evenly distributed with only a periodic weekly cycle visible. The average sales level, as the graph shows, would be lower. So it seems that promotion has a positive effect on sales and should be profitable. But is it really?

Prognza sprzedaży promowanej kategorii w zależności od scenariusza

A comprehensive model of promotion

When evaluating the effects of a promotion, one should look not only at the sales increase, but also at other phenomena related to the promotion that would not occur if there was no promotion. It is primarily about the shift of sales in time (in the example visible in the period just before and just after promotion), as well as about the impact of promotion of a given assortment on other product categories. For complementary categories, we expect a positive impact on sales. However, for other categories (for example, non-promoted substitute products), the effect may be negative. It is the interaction between these different effects that determines the overall profitability of the promotion. It is therefore necessary to estimate them precisely. A model built and tested with the use of data science methods makes it possible.

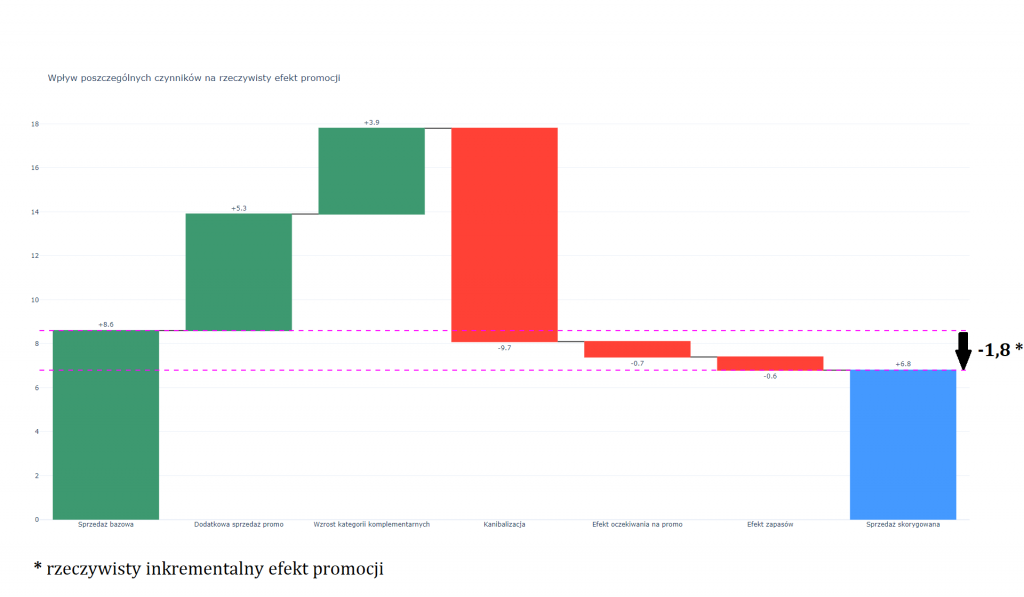
The diagram below visualizes the decomposition – the breakdown of the total effect of a promotion into individual components. The base sale is the sale that would have been realized if there had been no promotion.  The additional promo sales were estimated at 5.3 million using the model. This is how much more we sold of the products promoted by running the promotion.

Complementary category growth is the positive impact of the promotion on categories typically co-purchased with the promoted products. Cannibalization is the negative influence of a promotion on sales of other product categories – in this example it amounts to 9.7 million, thus cancelling out the entire positive effect of promotional activities. Additionally, effects related to the time shift in sales – before the campaign (the waiting effect) and after the campaign (the effect of buying on stock at lower prices) worsen the result of the action by another 1.3 million.  After taking into account all the above-mentioned effects of the promotion, total sales were 6.8 million, i.e. 1.8 million less than in the scenario without the promotion. Therefore, the real incremental impact of the promotion on sales is negative, i.e. the promotion was not profitable.

Wpływ czynników na rzeczywisty efekt promocji

Summary

In conclusion, a simplistic approach to promotion analysis and limiting itself to the effect of increased sales of promoted products during the promotion period may lead to incorrect conclusions and suboptimal decisions. Only a complex analysis based on a wide range of data and using advanced data science methods can answer the key questions from the point of view of promotion planning. Precise promotion models allow to accurately estimate particular effects, to accurately simulate alternative scenarios and to optimize not only single promotional campaigns, but the whole promotional calendar.