How did we achieve 30% better sales through data science?

Finding a compromise between maximizing profits and reducing costs is not an easy task for marketers planning marketing campaigns. For campaign ROI it is crucial to choose the right group to target. With help comes uplift modeling, which examines the likelihood of customer purchase. 

The middle of summer. A bit of a “dead” season. Conversations in the marketing department of one of the largest retailers in Poland concern not only impressions from vacations, but also how to stimulate sales a little. One of the employees suggests running a text message campaign. There is a consumer base that can be communicated with. There is even quite an attractive offer that can be written about. Nothing else to do but send it. A problem arises, though. The end of the financial year is approaching, so there is not much money left in the budget. Enough to hold a mailing to at most one-fifth of the base. Enthusiasm has subsided – there will be no fireworks. But what can be done to make the most of the limited budget and maximize the chances of achieving a noticeable effect? Someone comes up with an idea to get on to friendly data science consultants. Time is short and one should to act fast, but the experienced Data Science Logic team takes up the challenge.  

Can we predict the purchase?

We can describe consumers in the database on nearly 200 variables: in terms of transaction history, assortment purchased, price sensitivity, propensity to buy online, interaction with marketing communications, and visits to the retailer’s website. Analysts build a scoring model predicting the likelihood of interest in the promoted assortment for each consumer who could potentially be contacted. 

The available budget will be divided into two parts. Half of the consumers will be selected in the existing way. The other part will be the 10% of the most interested consumers according to the model’s prediction. Additionally, from among all those qualified for the mailing, a control group will be drawn, which will not receive the message. This division allows us to measure the effectiveness of the two targeting methods and the effect of the communication itself. 

Results: conversion rate in the group selected by the model is nearly 3 times higher than in the group selected by the previous method. The results speak for themselves. Data science wins. Or does it?

Are we sure we are looking at the right indicator?

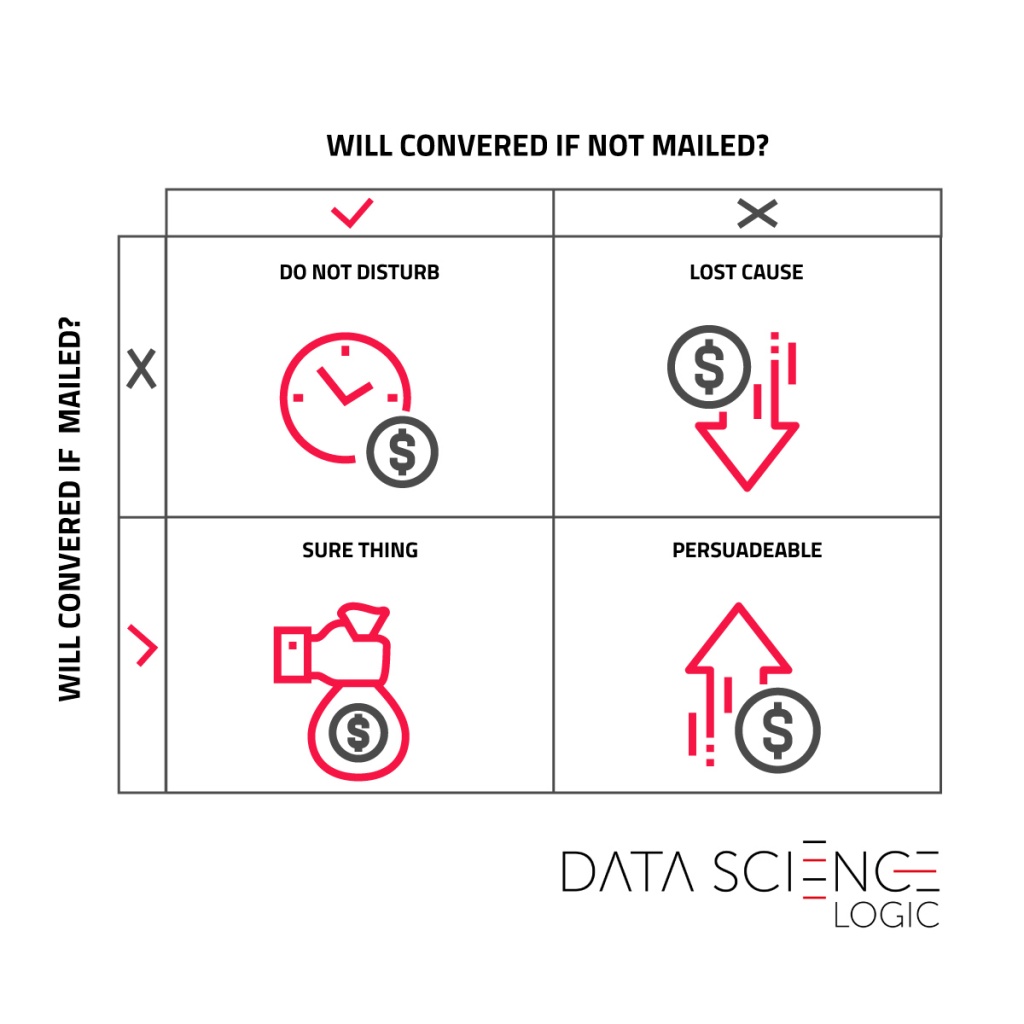
The conversion comparison shows that the model correctly predicted a group of consumers above average interested in buying. But were not these customers who would have completed the transaction anyway even without the text message? What was the actual impact of the mailing on their tendency to buy? We can find answers to these questions by making a comparison with a control group randomly excluded from the communication. It shows that the difference between the conversion in the entire messaged group and the conversion in the control group was about 1.8 percentage points. The difference is still in favor of the model, but is no longer so spectacular. This means that some of the consumers identified by the model were already sufficiently interested in the purchase before the communication, and there was no need to stimulate them additionally. So how can we classify consumers in terms of their expected response to a marketing communication?
Modelowanie uplift

The top left part is the people ‘Do not disturb‘ group, who would have been interested in the transaction, but disturbed by the unwanted communication abandon the purchase. The ‘Lost cause‘ section are consumers who we cannot convince to buy, even with a planned campaign. The ‘Sure thing‘ group are people willing to buy even without communication. Finally, the lower right square ‘Persuadable‘ group that is not yet convinced to buy and the campaign stimulus is able to impact the decision. So we have one group that is worth communicating and three that are not. But how to predict who is in this profitable group?

The uplift model

Again, data science comes with help. It is possible to build a model that will predict not so much the propensity to buy as the change of this propensity under the impact of communication. This is the so-called uplift model. The prediction of the model allows to rank consumers from those with the highest increase in purchase probability to those with the lowest (or even negative) change in interest in the transaction. Data scientists build an uplift model based on the data collected in the first mailing. Its application in the next experiment brings further increase of uplift – by almost 0.4 percentage points in comparison to the group selected by the response model. Seemingly little, but with the appropriate scale of the database translates into a significant number of additional transactions generated. Compared to the previously used selection methods, the response model generated 10% more additional sales, and the most advanced uplift model generated almost 30% more.
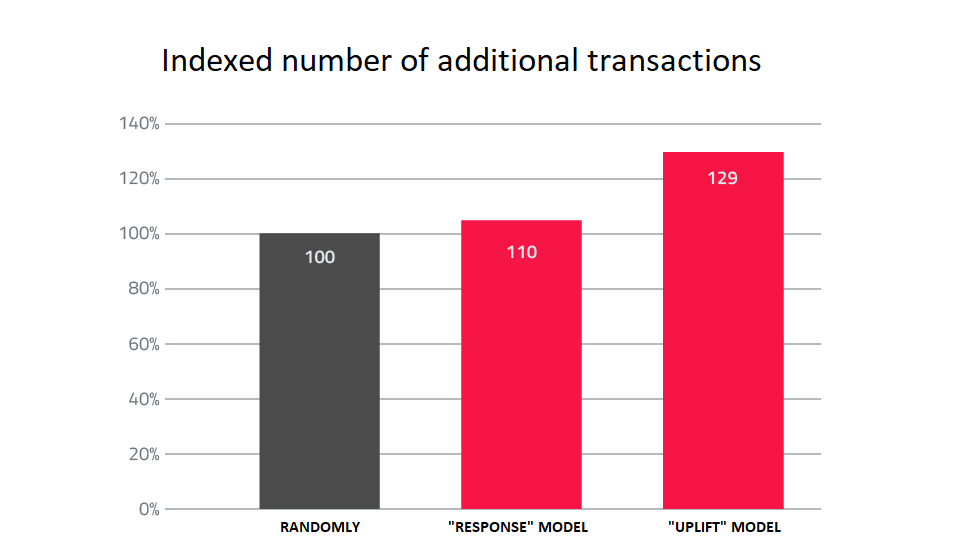
What we buy, spending the budget on communication with consumers, are in fact additional conversions that would not be achieved if it were not for the campaign. Properly selecting the group communicated, we can with the same budget generate significantly more incremental purchases. Uplift predictive modeling available among data scientists tools can be a significant help here.

NPS Survey – an Effective Tool to Optimise Marketing Communication

NPS (Net Promoter Score) survey has been known for nearly 20 years. Described in a Harvard Business Review article by Frederick F. Reichheld, NPS was well received by marketers and was adopted by many industries. It is estimated that up to two thirds of the largest US companies (included in Fortune 1000) use NPS.
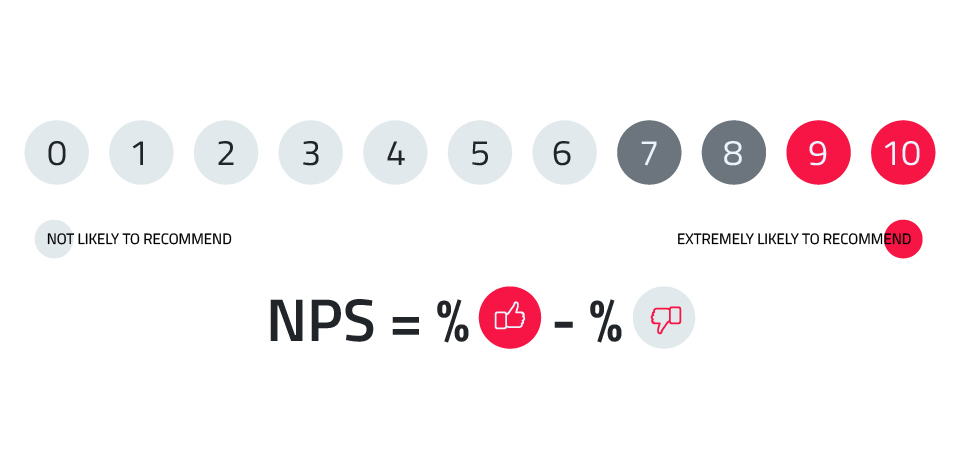
The basic version of the survey includes only one simple question: On a scale of 0 to 10, how likely are you to recommend the company to a friend? 

The respondents who answer 9 or 10 are referred to as promoters. They are brand ambassadors. They are worth pursuing because each one of them recommends the brand to up to 3 more people. Those with a score of 0 to 6 are detractors — unhappy customers tend to tell about it to 9 other people. The scores of 7 and 8 are considered neutral and are disregarded in determining the final score.

Advantages of the NPS survey

The NPS customer loyalty evaluation tool has several important advantages. Above all, these include a relatively simple survey, to which a customer can respond easily (the questionnaire is short and the question is simple) and an uncomplicated way of calculating the result. More important, a significant correlation has been shown between NPS and revenue growth rates. The examples for various industries can be found, among others, in the aforementioned Reichheld’s article. The analyses conducted on the Polish market show a relationship between the consumers’ NPS score and their purchasing behaviour, and even their inclination to interact with a brand. In today’s episode of the ‘We Love Data, So Let’s Date’ series, we would like to present one of such analyses.

In this article, we will focus on the opportunities offered by the analysis of de-anonymised responses given in an NPS survey. You must also remember that the lack of anonymity here does not mean knowing the respondent’s exact personal data, but rather being able to track their subsequent interactions with the brand, their purchase decisions and linking them to the NPS score. Is it possible to clearly determine to what extent the knowledge of a consumer’s attitude towards a brand expressed in an NPS survey can help optimise and personalise marketing communications?

Survey Conducted by Data Science Logic

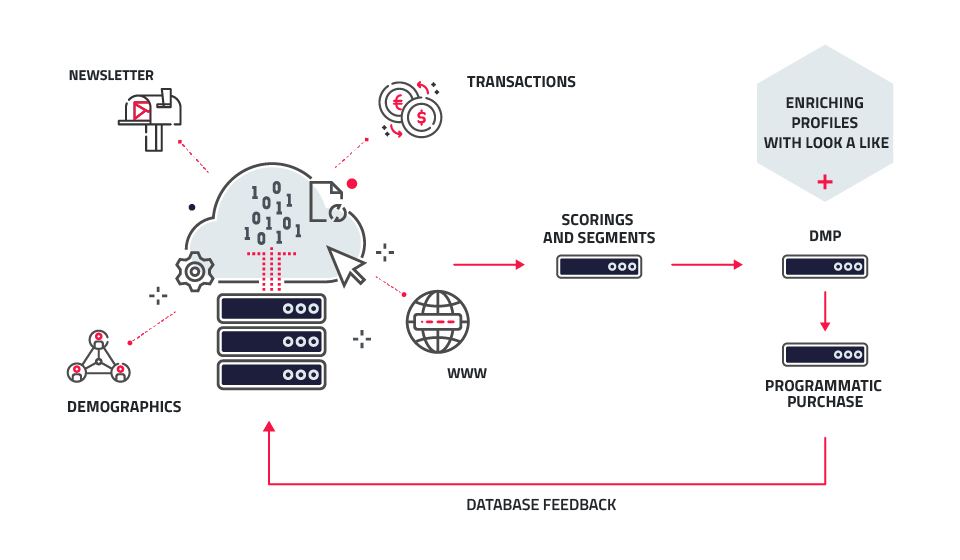
The presented results come from a study conducted on a sample of over 20,000 participants of a loyalty program of one of the largest retailers in Poland. We took into account the participants’ behaviours and their interactions with the brand in a period of 6 months after completing the survey. Thanks to an extensive consumer identification system, it was possible to track participants’ actions in various channels, including purchases in brick-and-mortar stores, online purchases, visits to the brand’s website, interaction with mailings (open rate, click rate) and text messages, as well as interactions with digital ads displayed on external websites.


General diagram of consumer data flow

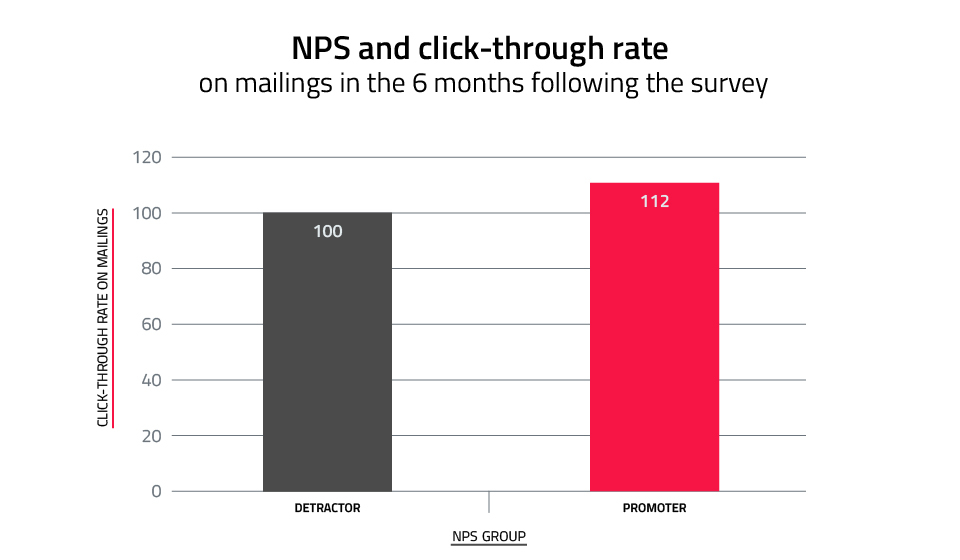
The conclusions from this study confirm the previously quoted observations and theses that point towards a definitely higher value of customer who displays a positive attitude towards the brand. The greater value of the customer-promoter is also influenced by their openness to communication activities conducted by the brand. Promoters had a 12% higher click rate compared to detractors. So they were clearly more likely to read the newsletter content and respond with clicks. 

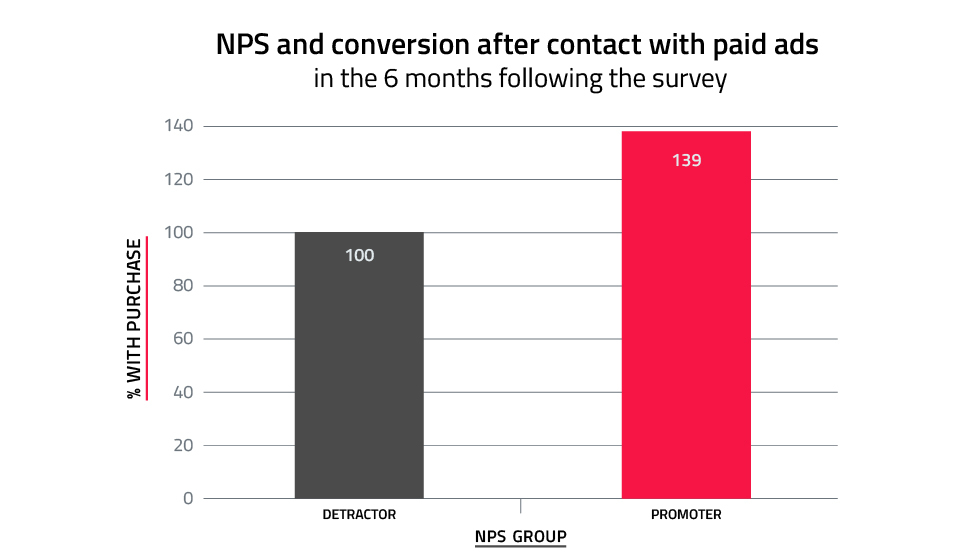
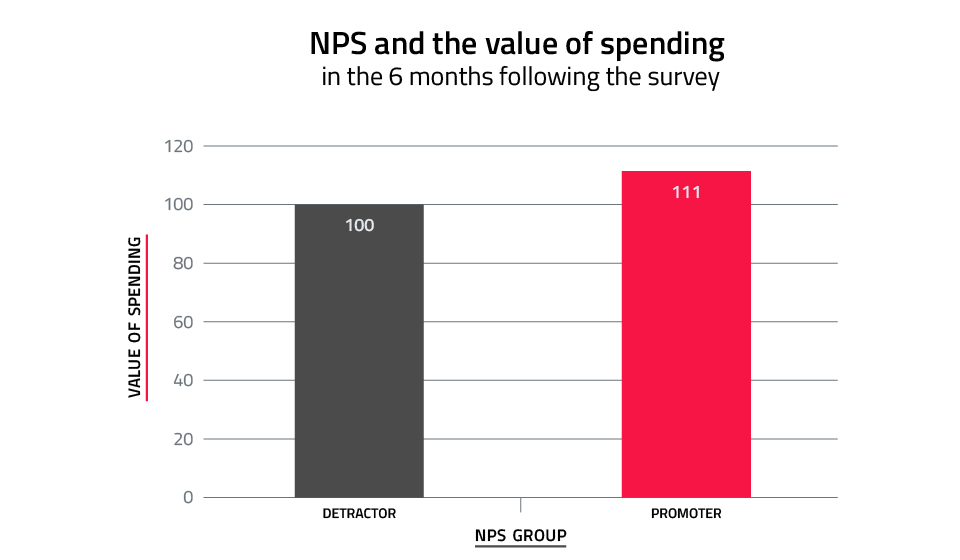
In order to facilitate the analysis of the results of this survey, the numbers in the above graph, and in the following ones presented in the article, are indexed in such a way that the values of the analysed feature for detractors is set at 100, and its value for promoters is proportionally higher or lower.

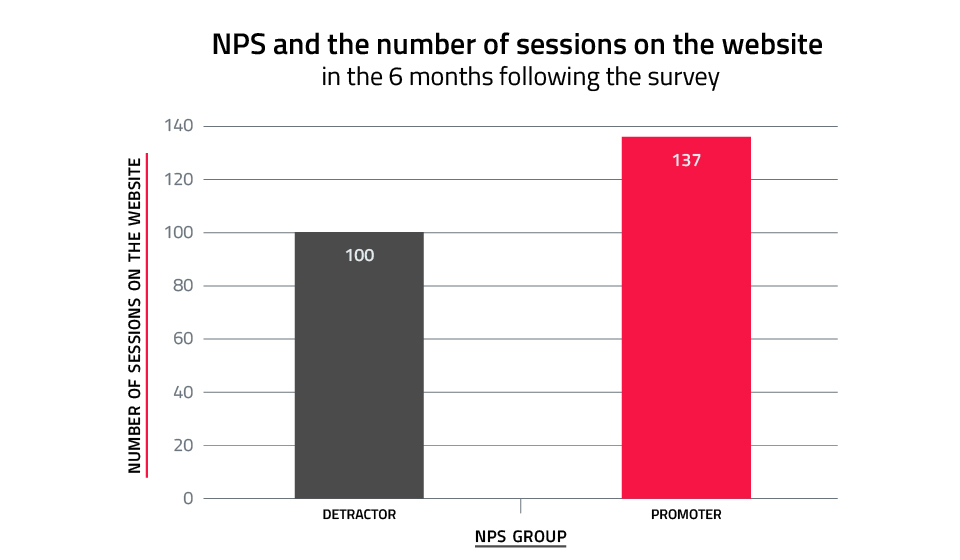
Higher click-through rates on mailings linking to a website or e-commerce site translated into a higher number of sessions on the website by up to 37%.

As it turns out, promoters reacted much more actively to brand messages in external media. Compared to detractors, they had nearly 40% higher interest in the communication after exposure to digital ads.

Positive attitude towards the brand, significant openness to newsletter communication and a greater willingness to respond to advertising messages translate into higher customer spending. In the period of 6 months after completing the survey, the promoters spent 11% more compared to brand detractors.

It is worth noting that this difference is the result of both higher frequency of transactions and higher average value of a single transaction.

So How Can You Use the Insights from NPS Analysis to Communicate More Effectively?

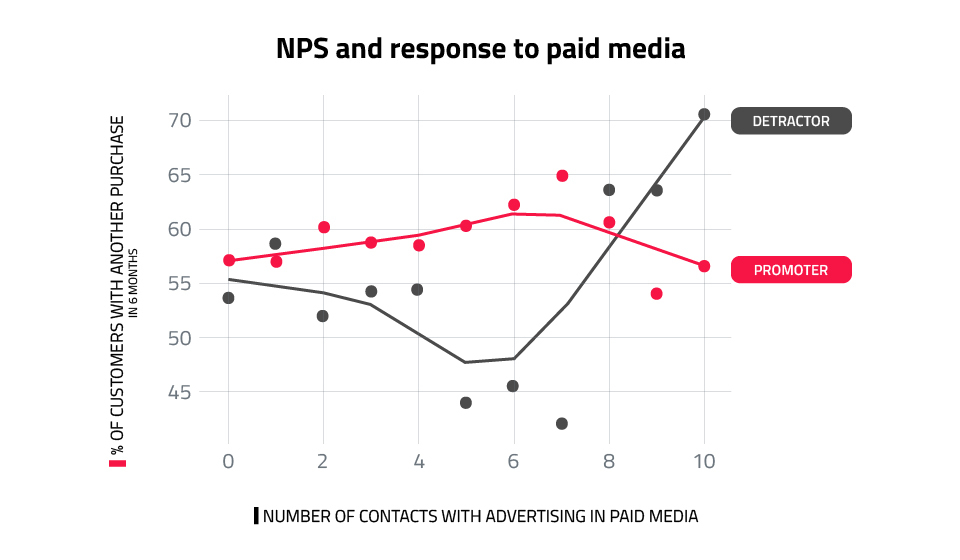
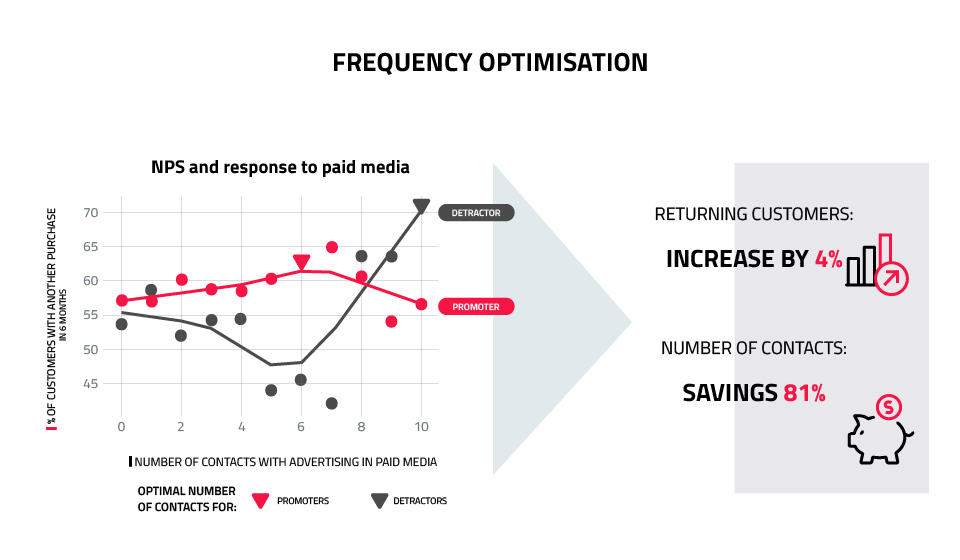
Data Science Logic decided that one idea in particular is worth verifying, i.e. how the adjustment of the frequency of paid media exposure impacts the consumer’s most recent NPS score. This proved to be an interesting lead. Based on the data analysed, it was clear that promoters and detractors respond differently to escalating communication intensity. Their ad saturation curve is completely different. In the case of promoters, increased frequency of exposure initially results in an increase in response. Advertising message overload was achieved with 6 contacts. For detractors, however, the initial effect of increasing the number of contacts was negative. Only after exceeding 8 ad displays the effect was comparable to the promoters group.

Using these observations to optimise the number of ad displays, you can assume 6 is the limit for promoters. If you have not convinced the promoter within this time, you should let go of further attempts. This saves budget and reduces the risk of over-saturating the consumer with ads, thus preventing the promoter to join the group of unhappy customers. However, you should adopt completely different guidelines for detractors. In their case, it pays to aim for 8 or more ad displays. By applying the described optimisation, you could significantly reduce the number of contacts and save up to 80% of the budget, with the same effect (or even potentially slightly better, i.e. by 4%). Our analysis assumes that we only affect the frequency of communication, leaving everything else unchanged.

Further efficiencies can be gained by also testing the differentiation of consumer-facing content depending on the consumer’s last and previous NPS score. This applies to both paid advertising and communication based on own media: mailing, text messages, website personalisation.

Summary

So, to sum up the presented results, it should be noted that they depend on the conditions specific to a particular company, e.g. on the industry, frequency of purchases, nature and activity of the competition, consumer features. It is therefore worth conducting a similar analysis using your own data. To do this, you will need an NPS survey, conducted systematically in a way that allows you to link responses to a consumer identifier, and covers a wide range of channels in which consumer interactions with the brand are tracked. The wider the range of points of contact with the brand, where you can register consumer behaviour, the greater the possibilities to optimise the activities. NPS survey data can be a valuable addition, opening up additional opportunities.

Net Promoter Score is more than just a question. It allows you to get to know your customers better. NPS is a strong indicator of loyalty and, as it turns out, can be used to optimise marketing communications. Asking one simple question will help you reduce your paid media costs and reach the right customers with the right message. Of course, as long as you combine the answers you get with other valuable information about your customers.

Characteristics of an effective data scientist

Recently, people dealing with Data Science are one of the most sought-after specialists in the labour market. The demand for data scientists is already demonstrated not only by IT industries, but also by companies
that have not yet dealt with the analysis of large information resources.  

What competencies should a data scientist have? What should characterise him or her? Are there competencies without which this profession cannot be pursued? The best specialists are described by certain features that distinguish them from the crowd of ordinary analysts.

When we think of employees in this field, we usually look at analytical qualifications. Much less often “soft” skills are mentioned, which are also very important in this industry. Before they start working, data scientists must master
several important skills without which working in this interdisciplinary field would not be possible.

There is my (subjective) list of qualities that every good data scientist should have, and we will start it a bit puckishly
with something that hardly anyone mentions at the beginning, i.e. communication skills.

1. COMMUNICATION

In the work of data scientist it is extremely important to communicate skilfully. The key to success is effective communication during each stage of the project. The specialist has to communicate accurately while defining the problem, analysing it, solving it and also during presentation to other team members. They need to be able to talk to both data scientistsand people who don’t know the industry very well. Explaining data to non-analytical team members is usually the most complicated stage of the communication process during the whole project. It has to be done in an understandable way and using simple language so that team members without technical preparation can assimilate the subject. It is important to be able to explain complicated things in an easy way. Data scientist must remember to adapt the way of communication to the capabilities and needs of their recipient.

2. KNOWLEDGE OF ALGORITHMS AND METHODS

Theoretical and practical knowledge of algorithms is also a solid foundation for understanding and learning new approaches. Scientists involved in data analysis should be able to easily assimilate new methods. Big data is a
topic that is currently in full bloom and will certainly uncover many more of its possibilities. What we know today, tomorrow may turn out to be outdated by new solutions, so an effective data scientist should easily use new,
previously unknown methods and solutions. Studying and using algorithms in practice develops intuition, which contributes to more effective problem solving.

3. PROGRAMMING SKILLS

This may seem obvious, but it is a basis that cannot be forgotten when completing a list of skills of data scientist.
A good knowledge of at least one programming language is a must: R or Python, and, importantly, having the ability
to quickly assimilate
, learn and use new unknown tools. The data science industry is growing fast, so effective data scientist can’t stop learning. (S)he should constantly expand their programming skills. The world of data science tools is
changing extremely fast. A good data scientist should be willing to learn and gain new qualifications.

What is more, it is a feature that distinguishes the data scientist from an ordinary analyst. The data scientists must program their solutions to work automatically. Analysis of huge data resources cannot be done on a piece of paper,
so knowledge of any programming language is essential to be able to work efficiently.

4. SQL KNOWLEDGE

Another feature, associated with the previous skill, is knowledge of SQL. One may wonder if this shouldn’t be treated simply as one of the programming languages. But I want to underline its special role. Despite the flourishing NoSQL databases and various alternative ways of storing large data sets, SQL is still irreplaceable in many solutions. It is the most effective way of acquiring and preparing data for further work. Knowledge of SQL is an essential competence of data scientist due to frequent work with huge databases.

5. CURIOSITY

Data scientist must be curious, ask questions and search answers, dig deeper all the time. They should be open to new experiences and constantly looking for better, more modern solutions. The data science industry changes from day to day. Better and better solutions and more interesting methods are being developed. While working in this profession, you have to constantly develop your skills so that one day you don’t find out that you’ve slept through an innovation without which you’re not as productive as you used to be. What counts in the industry is the effectiveness, efficiency and simplicity of solutions, so unsatisfied curiosity is something that accompanies every productive data scientist.

6. SCEPTICISM

Another feature that should characterise a data specialist is common sense. It leads to a rigorous approach to the analyses performed, their verification, a thorough check whether the “discovery” made does not result from an error
in the data, in the applied methodology or in the interpretation of results. You can’t be sure of anything in life, that’s why a data scientist should be scrupulous about what (s)he does and take all results with a ‘pinch of salt’. Scepticism allows you to be critical even of your own work results, which can eliminate the possibility of error.

7. BUSINESS APPROACH

To understand the problem to be solved by a data scientist, it is good to know a little about the business the query is about. Understanding the wider context and conditions in which business operates is often necessary to achieve the best results. Without this it is difficult to find the right method to solve the problem.

Summary, an effective data scientist must combine analytical, programming, business, and soft skills such as ease of communication. Not without reason, the data scientists are the most sought-after specialists in the labour market.
It is not easy to meet all the requirements, but many of them can be learned through continuous improvement
of one’s work. However, if you meet all the requirements to be a data scientist, you can contribute to innovative problem-solving in many industries, and finding an interesting job with many career opportunities will not be
a problem at all.

How much more valuable is
a customer who trusts you?

We tried to find an answer to this question together with Maria Galas (IKEA Group) and Adam Wysocki (LVLUP Media) during IAB Forum 2020.

The fact that a customer who trusts the brand is worth more, is obvious. The question is – how much more? 5, 20, 100 times more? There has been no precise answer to this question so far, so we decided to give you one. The challenge was huge as we tried to measure something that is, by definition, difficult to measure –i.e. trust.

Our presentation was based on the results of analysis of the behaviour of real customers participating in IKEA Family program. Assuming that the highest form of trust is recommending the brand to friends, we have analysed the differences in behaviours between two groups of customers: brand promoters and critics. The analysis was based
on tens of thousands of receipts, interactions with thousands of mailings and advertisements in paid media.
The customers who trusted the brand turned out to be more willing to repeat purchases, came back more often and spent more. Additionally, the ROI on investment in advertising contacts with promoters was higher. A similar impact
on these customers could be achieved with almost 4 times fewer page views.

The conclusions of the analysis confirmed the thesis that it is worth taking care of customer trust, and also it is worth measuring it. This makes it possible to better anticipate the customer’s behaviour and to adapt the communication
to their needs and emotions.

Trust in a brand translates into sales, i.e. its specific financial results and how much the consumer spends.
And this is important for at least two reasons:

1. The customers who trust us spend more and more often

2. By building communication to a customer who trusts us, we have lower costs – we can achieve the same effect with less expense.

But what’s the most important, the customer who trusts the brand is the greatest added value.

8.31
Zrzut ekranu 2020-11-18 141239
Zrzut ekranu 2020-11-18 141301
previous arrow
next arrow